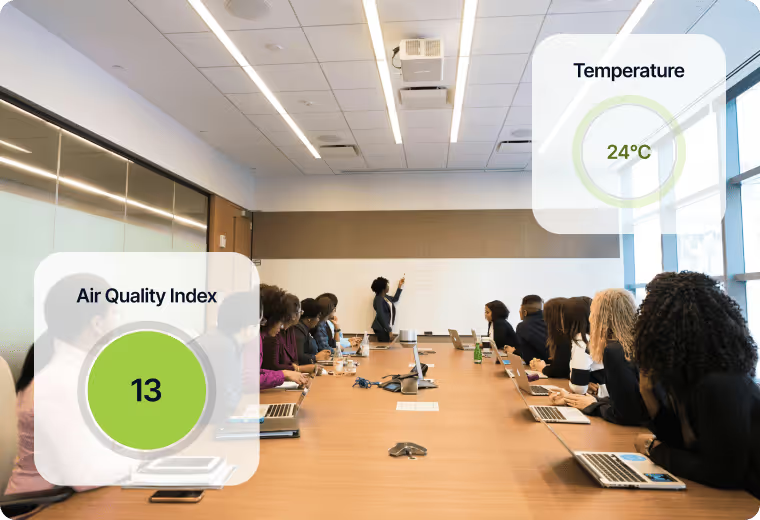
As organizations worldwide are taking advantage of the financial and health benefits of optimizing air quality, Triton is leading the charge with the most advanced environmental monitoring platorm.
1
Sense
Multiple highly advanced and calibrated sensors in a single hardware unit, collecting 518,400 data points per day.
2
Monitor
Data is ingested to Triton’s powerful management software. From there, set alert thresholds, view and compare trends, integrate with 3rd party platforms, generate reports, and analyize with AI.
3
Optimize
Use your data and Triton Insights to take action. Optimize for health, productivity, and energy efficiency across your organization.
What It Monitors
Environmental Readings
Particulate Levels: PM 1.0 PM 2.5, PM 4.0, PM 10
Temperature (C and F)
Humidity
Carbon Dioxide (CO2)
Total Volatile Organic Compounds (TVOCs)
Nitrogen Oxides (NOx)
Sound Level (decibels)
Health Index
Air Quality Index
Other Readings
People Count
Motion
Dwell Time (Loitering)
Drug Activity (Vape, THC, etc.)
Emergency Keyword and Aggression Indicators
Ready to Explore Triton?
Meet with our air quality experts to see how your building could benefit.
Triton integrates into your existing operations, automating efficiency and helping inform smarter, healthier buildings.
Exploring CO2’s Effect on Health and Productivity
Optimizing workplace air quality is a crucial investment in employee health and productivity.
Poor air quality negatively impacts well-being and performance.
Health Benefits
Reduces respiratory issues, sick leave, and enhances cognitive function and overall well-being.
Emergency Keywords
Increases focus, output, and improves decision-making.
Reduces employee turnover by fostering a positive environment.
How It Works
As organizations worldwide are taking advantage of the financial and health benefits of optimizing air quality, Triton is leading the charge with the most advanced environmental monitoring platorm.
CO₂ Concentration (ppm)
Effects in the Workplace
400–1,000 ppm
Normal range. Air feels fresh and comfortable; optimal focus and productivity.
1,000–1,500 ppm
Stale air begins to build up. Mild drowsiness, reduced alertness, and slight decline in concentration.
1,500–2,500 ppm
Poor air quality. Noticeable fatigue, headaches, and reduced cognitive performance. Complaints about stuffiness are common.
>2,500 ppm
Very poor and potentially unsafe. Dizziness, nausea, and significant drops in productivity. Ventilation should be improved immediately.
Using Triton’s CO2 Sensors to Identify Anomalies and Control Building Ventilation
Triton integrates with third-party software via its API, enabling automated workflows and streamlined regulatory reporting. This helps organizations optimize environmental conditions, automate anomaly responses, and simplify air quality compliance, improving efficiency and reducing manual oversight.